

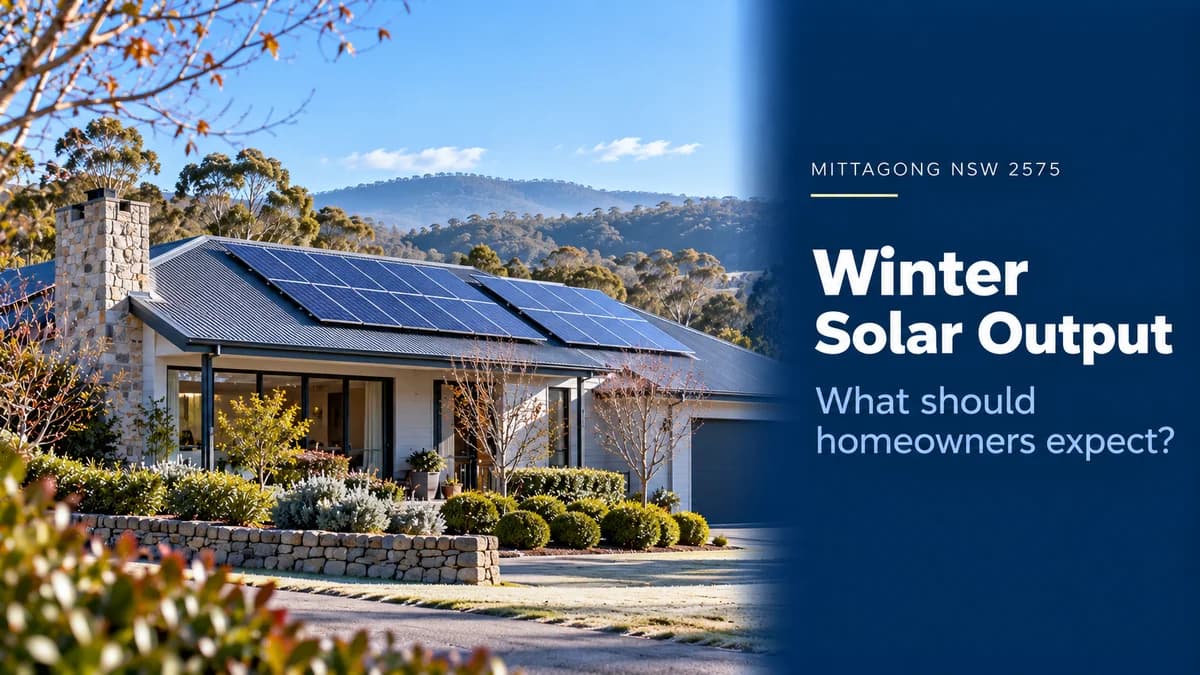
Winter Solar Output Mittagong NSW: What to Expect
How much less solar do Mittagong NSW 2575 homes generate in winter? See local BOM solar-exposure data, seasonal factors and practical system-sizing advice.
Winter Solar Output in Mittagong: What Should Homeowners Expect?
If you are considering solar in Mittagong NSW 2575, one question is especially relevant in the Southern Highlands:
How well will solar panels perform during winter?
Solar panels continue generating electricity throughout winter, including on cool and partly cloudy days. However, daily generation is normally lower than in summer because winter brings:
Shorter daylight hours
A lower sun angle
Lower average solar exposure
Potentially greater seasonal shading
For local costs, the STC rebate for 2575 and what we check on a Mittagong roof, see solar panels in Mittagong.
For Mittagong homeowners, that means solar should be assessed on annual performance, not judged only by the lowest-output winter months.
Kratos Energy's Solar Output Calculator can provide a postcode-based annual estimate for 2575, but understanding the seasonal pattern helps set more realistic expectations. (Kratos Energy)
How Much Less Sun Does Mittagong Receive in Winter?
The Bureau of Meteorology publishes long-term solar-exposure data for its Mittagong (Alfred Street) climate station.
Average daily solar exposure is:
Month | Mean Daily Solar Exposure | Equivalent Solar Energy* |
January | 21.3 MJ/m²/day | ~5.9 kWh/m²/day |
May | 10.1 MJ/m²/day | ~2.8 kWh/m²/day |
June | 8.4 MJ/m²/day | ~2.3 kWh/m²/day |
July | 9.6 MJ/m²/day | ~2.7 kWh/m²/day |
August | 12.6 MJ/m²/day | ~3.5 kWh/m²/day |
December | 22.5 MJ/m²/day | ~6.3 kWh/m²/day |
*MJ/m² converted to kWh/m² by dividing by 3.6. These figures describe solar exposure at the weather station, not the electricity output of a particular rooftop solar system. (Bureau of Meteorology)
The seasonal difference is significant.
For example:
June solar exposure is approximately 39% of January's level.
That does not mean every solar system will generate exactly 61% less electricity in June. Panel orientation, tilt, shading, weather and inverter design all affect actual generation.
But it clearly shows why winter daily output in Mittagong is expected to be lower than summer output.
Does Cold Weather Stop Solar Panels Working?
No.
Solar panels generate electricity from light, not heat.
The Australian Government states that panel output depends on factors including:
Sunlight
Season
Weather
Panel direction
Panel angle
Shade
System design
Panels can also generate some electricity under cloudy conditions because they respond to both direct and diffuse sunlight. (Energy.gov.au)
So a cold, clear Mittagong winter day can still produce useful solar electricity.
The main seasonal limitation is the amount and duration of available sunlight, rather than low air temperature itself.
Why Winter Solar Output Drops in Mittagong
1. Shorter Days
Winter provides fewer daylight hours.
That means there are fewer hours available for the solar array to generate electricity.
Even if peak midday power remains strong on a clear day, the total daily kWh can still be substantially lower than in summer.
2. Lower Sun Angle
The winter sun sits lower in the sky.
This affects how sunlight strikes the panels and can also increase shading from:
Trees
Chimneys
Neighbouring buildings
Hills or roof features
Energy.gov.au notes that shading is often greater in winter because the sun is lower. (Energy.gov.au)
For a Southern Highlands property with established trees, seasonal shade should therefore be included in the solar design.
3. Lower Winter Solar Exposure
The BOM data makes this especially clear.
Mittagong's mean daily solar exposure is approximately:
21.3 MJ/m² in January
compared with:
8.4 MJ/m² in June. (Bureau of Meteorology)
This lower available solar energy is the biggest reason winter generation falls.
What Does This Mean for a Rooftop Solar System?
The safest way to think about winter output is:
A system should be sized around annual household demand while acknowledging that summer generation will be higher and winter generation lower.
The Australian Government specifically recommends reviewing electricity consumption by season because solar systems generate less electricity in winter than summer. (Energy.gov.au)
This is important for Mittagong because electricity demand may also rise during colder months due to:
Reverse-cycle heating
Electric heaters
Longer lighting periods
Heat-pump hot water
Increased indoor appliance use
So winter can create a combination of:
lower solar generation + higher household electricity demand.
Example: Why Annual Averages Can Be Misleading
Imagine an illustrative Mittagong household whose solar system averages:
26kWh/day across the year.
That does not mean the system should be expected to produce 26kWh every day.
A realistic annual profile may include:
Much higher generation on clear summer days
Moderate generation in spring and autumn
Lower generation through winter
Very low output on heavily overcast days
The annual average is still useful for financial modelling.
But it should not be interpreted as a guaranteed daily figure.
Kratos makes the same distinction in its postcode calculator, noting that summer days run above the annual average while winter days run below it. (Kratos Energy)
Mittagong Solar: Why Roof Orientation Matters More in Winter
A well-positioned roof can help improve winter performance.
North-Facing Panels
In Australia, north-facing panels generally receive strong all-day solar access.
This can be particularly useful when the winter sun is lower.
East-Facing Panels
Produce more electricity earlier in the day.
They may suit households with stronger morning loads.
West-Facing Panels
Produce more electricity later in the afternoon.
They can be useful where heating or household demand rises later in the day.
The ideal design does not always require every panel to face north.
It should match:
roof availability + shade + household consumption.
Winter Shade Should Be Modelled Before Installation
A roof that looks excellent during summer can perform differently in June or July.
For example, a nearby tree may cast:
almost no midday shade in December
but a much longer shadow across the array during winter.
A good Mittagong solar assessment should therefore consider:
Tree height
Winter sun path
Nearby buildings
Chimneys
Roof orientation
Future vegetation growth
This is particularly important because seasonal shading can amplify the already lower winter solar exposure.
Should You Install a Bigger Solar System Because of Winter?
Not automatically.
Oversizing solar solely to maximise June output may create large excess generation through spring and summer.
Instead, system size should consider:
Annual electricity consumption
Daytime usage
Winter heating demand
Summer consumption
Roof area
Export conditions
Future EV or battery plans
Energy.gov.au recommends sizing rooftop solar using seasonal electricity data and considering future loads such as electric heating, hot water, pools and EVs. (Energy.gov.au)
For many households, the better question is not:
“How do I completely cover winter usage?”
but:
“What system gives me the strongest annual result?”
6.6kW vs 10kW Solar in Mittagong
A 6.6kW system may be suitable for a moderate-use household with:
Standard family consumption
Good roof orientation
Limited major electrical loads
No significant future demand increase
A 10kW system may deserve investigation where the household has:
Reverse-cycle heating
Higher annual electricity use
Pool equipment
Home-office loads
Battery plans
EV charging
More usable roof space
Kratos currently positions its 10kW residential system as providing additional generation headroom for homes with higher electricity demand and future electrification. (Kratos Energy)
Compare Kratos residential solar systems.
Local Housing Context in Mittagong
Mittagong has a strongly detached residential housing profile.
The 2021 Census recorded approximately 83.6% of occupied private dwellings in Mittagong as separate houses, while about 45.4% had four or more bedrooms. (Australian Bureau of Statistics)
That provides substantial rooftop-solar potential across the suburb.
But larger detached houses can also have higher winter loads from:
Heating
Multiple occupied rooms
Electric hot water
Home offices
Additional appliances
For this reason, local solar sizing should be based on the property's actual electricity data rather than assuming that every Mittagong home needs the same system.
How to Estimate Your Winter Solar Output More Accurately
Use a four-step approach.
Step 1: Start With Your Annual Estimate
Enter postcode 2575 into the Kratos Solar Output Calculator.
This gives an indicative annual generation baseline.
Step 2: Review Your Roof
Check:
Orientation
Panel tilt
Tree shade
Winter-specific shade
Usable roof area
Step 3: Compare With Monitoring Data
If solar is already installed, compare:
June/July production vs December/January production.
Look at several years where available rather than one unusually cloudy winter.
Step 4: Compare Production With Seasonal Consumption
Review winter electricity bills or smart-meter data.
You may discover that lower winter generation coincides with substantially higher heating demand.
That information is useful when deciding whether to:
Increase solar capacity
Change appliance timing
Add battery storage
Improve home energy efficiency
Can a Battery Solve Low Winter Solar Generation?
A battery moves electricity through time.
It does not create additional solar energy.
If a battery receives only 5kWh of excess solar on a winter day, installing a 20kWh battery does not make 20kWh available.
For battery storage to work effectively, there still needs to be sufficient energy to charge it.
A battery can be useful for:
Moving daytime solar into the evening
Reducing evening grid imports
Backup power
Time-of-use tariff management
But in winter, battery performance should be modelled using realistic seasonal solar surplus, not summer export figures.
Should You Judge Solar by Winter Alone?
No.
Solar is a long-term investment expected to operate through all four seasons.
A system may export substantial electricity through spring and summer while offsetting less consumption during winter.
The correct financial calculation considers:
annual generation + annual self-consumption + exports + electricity tariff
rather than focusing only on June or July.
That is why annual solar-output estimates and annual electricity data are more useful for system sizing than one winter bill.
Mittagong Is Within the Endeavour Energy Network
Mittagong forms part of Endeavour Energy's Southern Highlands network area. Endeavour Energy identifies Bowral, Mittagong and Moss Vale among the major communities within this part of its network. (Endeavour Energy)
This means the final solar design also needs to satisfy applicable network connection and export requirements.
Roof space alone does not determine how a system can be connected.
Your installer should confirm:
Supply phase
Inverter capacity
Network approval
Export settings
Current connection requirements
before finalising the system.
Winter Solar Checklist for Mittagong Homeowners
Before judging whether your system is performing properly, check:
Weather
Was the comparison day clear or cloudy?
Season
Are you comparing winter output against another winter period?
Shade
Do trees create more winter shade?
Monitoring
Has output dropped suddenly or gradually?
Roof
Have new obstructions appeared?
Consumption
Has heating increased your grid demand?
System
Are there inverter warnings or faults?
A lower July figure than a December figure is expected.
A sudden unexplained decline under similar seasonal conditions deserves further investigation.
Frequently Asked Questions
Do solar panels work in winter in Mittagong?
How much lower is Mittagong's winter sunlight?
Does cold weather damage solar generation?
Will a 6.6kW system still work in winter?
Should I install 10kW because Mittagong has lower winter solar?
Does shade get worse during winter?
Can a battery compensate for low winter generation?
Which electricity network covers Mittagong?
Winter Solar in Mittagong: The Bottom Line
Solar still works throughout winter in Mittagong NSW 2575, but homeowners should expect a clear seasonal reduction in daily production.
Local BOM data shows why:
January: 21.3 MJ/m²/day solar exposure
June: 8.4 MJ/m²/day solar exposure
July: 9.6 MJ/m²/day solar exposure
August: 12.6 MJ/m²/day solar exposure. (Bureau of Meteorology)
The best system is therefore one designed around:
annual consumption + winter demand + roof orientation + seasonal shade + future electricity needs.
Do not judge a solar investment from its lowest-output month.
Judge it by how effectively it reduces grid electricity purchases across the entire year.
Calculate solar output for postcode 2575
Compare Kratos residential solar systems
Request a tailored Kratos solar quote
Winter output is only one part of the picture. Good solar design is about making the whole year work.
Solar System Packages
Tier 1 panels & CEC accredited installation.
- Trina 475W or Jinko panels
- 5kW power inverter
- 14 × 475W panels
- Single-phase compatible
- Trina 475W or Jinko panels
- 8–10kW power inverter
- 21 × 475W panels
- Battery & EV ready
- Trina 475W or Jinko panels
- 10kW power inverter
- 27 × 475W panels
- Three-phase compatible